
Article Highlights
- Define the business outcome and critical user journeys before reviewing the optimization backlog.
- Build a baseline across user experience, reliability, delivery, security, architecture, cost, and capacity.
- Address critical production, security, compliance, and data risks before scoring other initiatives.
- Rank remaining work by measurable impact, risk reduction, reach, dependency value, and evidence confidence.
- Structure the product optimization roadmap as small waves with defined owners, metrics, guardrails, and exit criteria.
- Measure actual results after release and reprioritize the backlog when evidence or product conditions change.
Product optimization should begin with the confirmed constraint or material risk that has the greatest effect on users, business outcomes, or operational exposure. Every proposed improvement should have supporting evidence, an accountable owner, a target metric, and a defined validation method.
Products often have competing needs across reliability, usability, architecture, delivery speed, and infrastructure cost. Addressing them without a shared priority model can distribute engineering effort across unrelated initiatives and make results difficult to measure.
A product optimization roadmap creates a sequence for this work. It connects business outcomes to critical user journeys, confirmed product constraints, and measurable improvements. This gives product and engineering teams a common basis for deciding what to fix first, what can wait, and how each change will be evaluated.
Define What the Product Needs to Improve
Before reviewing the backlog, define the result the current optimization cycle should produce. Without a specific outcome, reliability, UX, architecture, delivery, and cost initiatives will compete for the same capacity without a shared evaluation criterion.
The team should identify the business outcome that needs to change and the user journeys that influence it most. It should also separate problems confirmed by data from assumptions, document the constraints affecting the existing product roadmap, and define what remains outside the current scope.
The objective should connect a business problem to an optimization goal and a metric that can confirm progress. The table shows how this connection can be structured.
| Business problem | Optimization goal | Possible metric |
|---|---|---|
| Users abandon onboarding | Reduce friction in account creation | Completion rate and abandonment rate |
| Enterprise clients report instability | Improve reliability of critical workflows | Successful transaction rate and SLO compliance |
| Releases take too long | Reduce delivery bottlenecks | Change lead time |
| Infrastructure cost grows faster than usage | Improve resource efficiency | Cost per customer or transaction |
| Support volume is increasing | Remove recurring product failures | Tickets per 1,000 active users |
The next step is to identify the Critical User Journeys: the end-to-end actions through which users receive the product’s main value. Depending on the product, these can include registration, checkout, payment, search, report generation, or document submission.
Google SRE’s product-focused reliability guidance explains that measuring individual services provides only a partial view of user and business outcomes. It recommends modeling reliability around user objectives and the steps required to complete them, then prioritizing measurements according to product criticality.
This distinction matters when building a product optimization roadmap. A backend service can meet its availability target while a user still cannot complete a payment, generate a report, or submit a document because another part of the journey has failed.
Section output: A concise optimization brief containing the business goal, critical user journeys, confirmed problems, scope exclusions, accountable owner, target metrics, and validation method.
Build a Product Health Baseline
A product optimization roadmap should not be based on internal opinions alone. The team needs a product health baseline that shows where users encounter friction, where operational risk is concentrated, and which constraints affect delivery or cost.
The baseline does not require perfect data across every system. It needs enough reliable evidence to identify the current constraint, quantify its impact, and compare results after an improvement is released. The assessment should cover five areas.
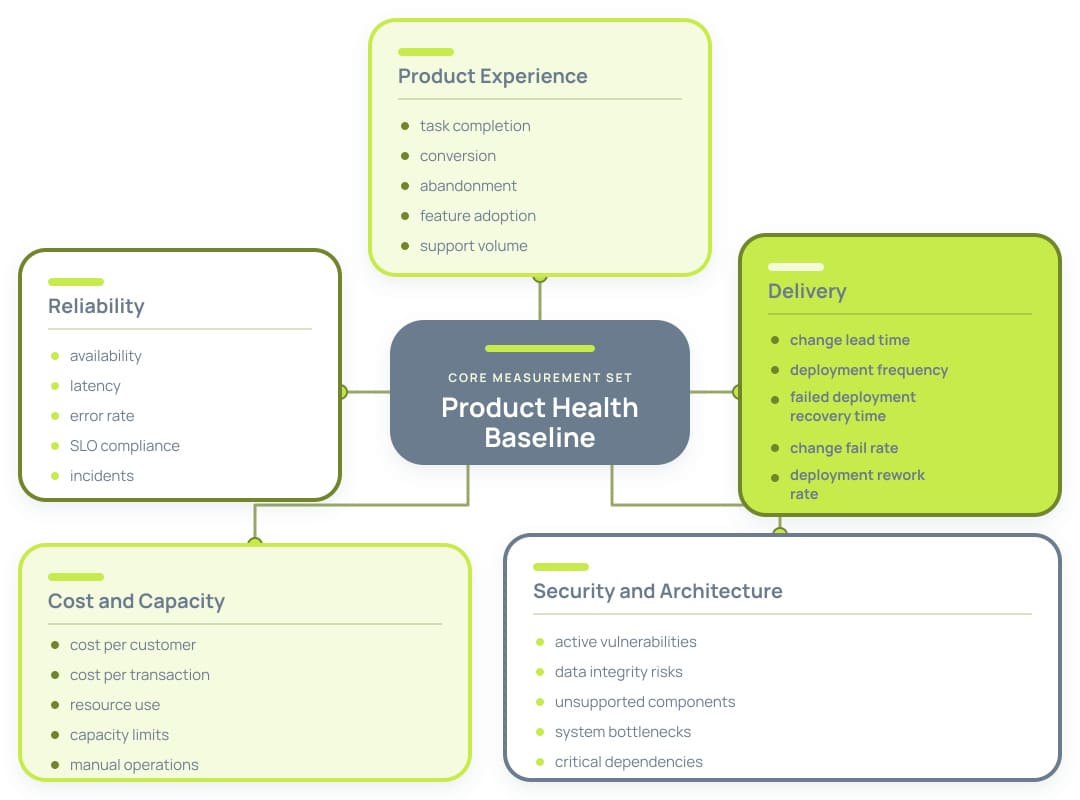
Image 1. Product Health Baseline Areas
Product and User Experience
Measure conversion, task completion, abandonment points, feature adoption, user complaints, and support volume. Connect these signals to Critical User Journeys so the team can distinguish an isolated interface issue from a problem that prevents users from completing an important action.
Performance should be evaluated across real devices, browsers, network conditions, and locations. For web products, laboratory tests are useful during development but cannot replace field data. Google recommends using field data to evaluate real-user experience and assesses Core Web Vitals at the 75th percentile of page loads, separately for mobile and desktop.
Reliability and Operations
Collect availability, successful request rate, p95 and p99 latency, error and timeout rates, SLO compliance, incidents, affected users, manual recovery steps, and known capacity limits.
P95 latency shows the response time within which 95% of requests complete, while p99 exposes delays affecting the slowest 1%. These percentiles reveal performance problems that an average response time can hide.
SLO compliance shows whether the product met its agreed reliability target during a defined measurement period. For example, an SLO can require 99.9% of payment attempts to complete successfully within a specified time. Results should be segmented by critical journey or product function where the available telemetry supports it.
Google SRE defines an error budget as the difference between the SLO target and 100% reliability. Teams can use it to make explicit decisions about feature delivery and reliability work instead of treating availability as a reporting metric only.
Software Delivery
Delivery performance shows how quickly the team can implement and validate improvements. DORA currently defines five software delivery metrics: change lead time, deployment frequency, failed deployment recovery time, change fail rate, and deployment rework rate. The first three measure throughput, while the final two indicate deployment instability.
Apply these metrics to a specific application or service and monitor their direction over time.
Security and Architecture
Record known vulnerabilities, exposed dependencies, access-control gaps, data integrity risks, and unsupported components. Review code and database hotspots, tightly coupled modules, system bottlenecks, and critical third-party dependencies that can delay changes or increase failure impact.
The baseline should identify the affected product area and business consequence rather than listing technical findings without context. A dependency becomes a roadmap priority when it creates material security exposure, blocks an important change, affects a critical journey, or makes recovery difficult.
Cost and Capacity
Measure cost per customer, transaction, report, or processed record alongside resource use, capacity limits, and manual operational work. Unit metrics provide a clearer efficiency signal than the total cloud bill because they connect technology spending to product demand and delivered value.
Rising cost is not automatically negative when the product delivers proportionally more business value. Unit costs help identify cases where spending grows faster than usage, throughput, or another relevant outcome.
Identify Observability Gaps
If the team cannot determine the source of latency, errors, failed journeys, or resource consumption, the missing telemetry is part of the product problem. Add the observability gap to the product optimization roadmap before committing to changes that cannot be diagnosed or validated.
OpenTelemetry defines traces, metrics, and logs as core telemetry signals for analyzing system behavior across services and requests. These signals should connect technical events to the affected journey, deployment, dependency, or resource.
Section output: A product health scorecard and a list of confirmed problems containing observed symptoms, affected journeys, baseline metrics, evidence sources, and responsible owners.
Prioritize the Remaining Optimization Backlog
After critical security, compliance, and availability risks have been separated for immediate action, the remaining initiatives can be evaluated through a shared scorecard. This gives the product optimization roadmap a consistent basis for comparing user experience, reliability, architecture, and cost improvements.
The percentages in the table represent the relative importance of each factor. Score every factor from 1 to 5, multiply the score by its weight, and add the weighted results. Because the weights total 100%, the final priority score remains on a 1-to-5 scale. For example, an impact score of 4 contributes 1.2 points to the total: 4 × 30%.
The suggested weights provide a starting point. Teams should adjust them to reflect the product’s business model, regulatory exposure, operating conditions, and current strategy.
| Factor | Question | Suggested weight |
|---|---|---|
| User and business impact | How strongly does the problem affect a critical journey, revenue, retention, or operations? | 30% |
| Risk reduction | How much operational, security, or compliance risk would the change remove? | 25% |
| Reach | What proportion of users, transactions, or teams would be affected? | 15% |
| Dependency value | Which subsequent initiatives would this work make possible? | 15% |
| Evidence confidence | How strongly do available data support the problem and expected outcome? | 15% |
The score indicates relative priority, but it should not hide delivery constraints. Record implementation effort, dependencies, technical uncertainty, and delivery risk separately. Two initiatives can receive the same priority score while requiring different sequencing because one depends on another system or carries greater implementation risk.
Technical debt belongs in the product optimization roadmap only when its effect is demonstrated. Relevant debt may slow frequent changes, contribute to incidents, create a security exposure, limit capacity, require recurring manual work, or increase unit cost. A code-quality concern without a measurable product, operational, or delivery consequence should not automatically displace a higher-value initiative.
DevOps Research and Assessment recommends mapping the complete software delivery value stream, identifying its main constraints, and concentrating improvements on the friction points connected to the target outcome. Improving one stage in isolation may leave overall lead time unchanged if the primary bottleneck remains elsewhere.
The final product optimization roadmap should contain a ranked backlog with the supporting rationale, weighted score, effort estimate, dependencies, implementation risks, and a record of rejected or deferred initiatives.
Section output: A ranked optimization backlog that explains why each initiative has its position and what could affect its delivery sequence.

Turn Priorities Into Optimization Waves
A product optimization roadmap should divide the selected initiatives into small, measurable waves. Each wave addresses a defined constraint, has its own success criteria, and produces evidence for the next decision. Waves represent implementation order rather than fixed periods, so their duration can differ.
These waves are a sequencing template rather than a mandatory order. The team should adjust them according to the confirmed constraint, active risk, dependencies, and available delivery capacity. Some initiatives can span several waves or proceed in parallel when ownership and dependencies are clear.
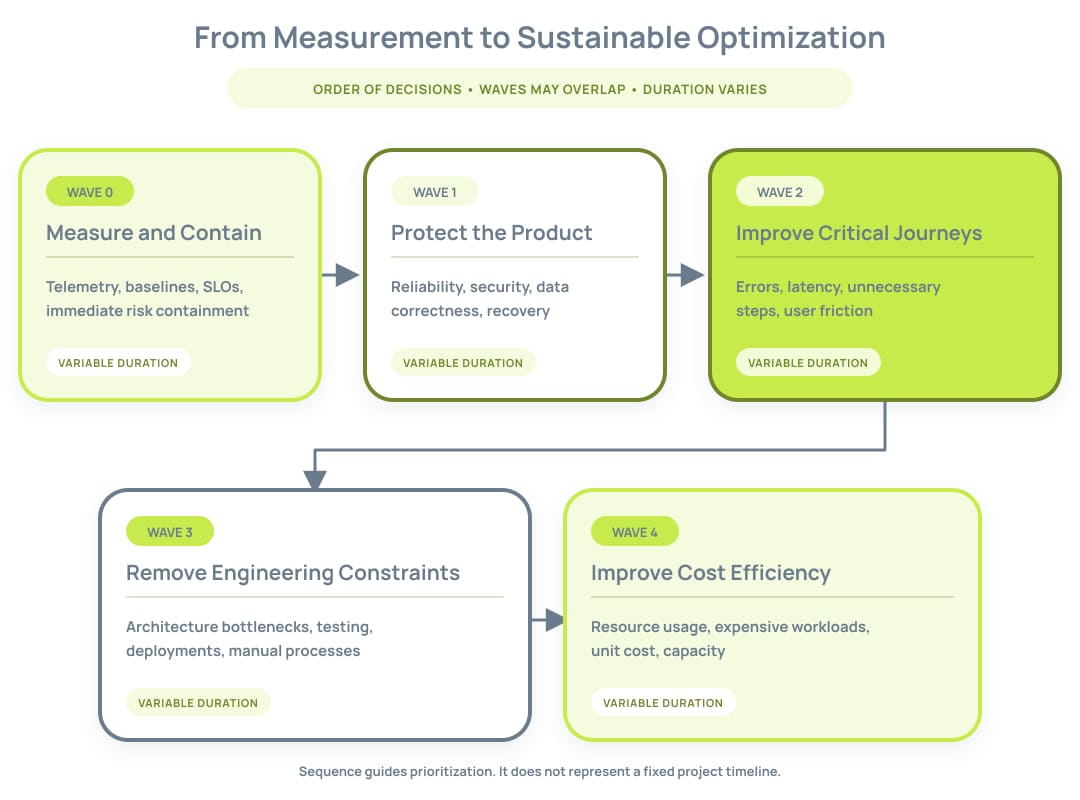
Image 2. Product Optimization Waves
Wave 0: Measure and Contain
Start by closing measurement gaps and limiting active risk. Add the missing telemetry, establish baseline metrics, define service-level objectives (SLOs) and alerts, and prepare rollback mechanisms. Immediate security, reliability, or data risks should be contained before broader optimization begins.
Wave 1: Protect Reliability, Security, and Data Correctness
Address recurring production failures, unsafe access paths, and errors in critical data. This wave can include automated recovery, validation, reconciliation, and controls for high-risk data changes. The goal is to reduce active operational exposure to an agreed level before changes to user journeys or delivery architecture proceed.
Wave 2: Improve Critical User Journeys
Focus on the journeys that have the strongest connection to the selected business outcome. Reduce errors and latency, remove unnecessary steps, improve slow queries and application programming interfaces (APIs), and correct problems affecting specific devices or regions. Validate each change against user and business metrics.
Wave 3: Remove Engineering Constraints
Resolve the technical constraints that delay frequent or high-value changes. Relevant work can include improving automated tests, reducing build and deployment time, separating components with different rates of change, and automating manual release tasks. Architecture work belongs in the product optimization roadmap when it has a confirmed effect on delivery, reliability, or a critical journey.
Wave 4: Improve Cost and Capacity
Review unused resources, overprovisioned infrastructure, storage, data transfer, expensive queries, and recurring processing jobs. Measure the result through unit metrics such as cost per customer, transaction, report, or processed record. Cost changes should not reduce reliability, security, or user experience below the agreed targets.
Define a Testable Hypothesis
Each initiative should state the expected change in measurable terms:
If we change X, metric Y should move from the current baseline to the target value without degrading guardrail metrics A and B.
Guardrail metrics identify negative effects outside the primary target. For example, a change intended to reduce response time should not increase error rates or infrastructure cost beyond the accepted limit.
Select the Rollout Method
Choose the release method according to the change and its risk. Options include a feature flag, canary release, limited user cohort, shadow traffic, load test, or A/B test. Define the rollback trigger before deployment so the team knows which result requires the change to be paused or reversed.
The completed product optimization roadmap should show the scope, owner, target metric, guardrails, rollout method, and exit criteria for every wave.
Section output: A phased roadmap in which each optimization wave addresses a confirmed constraint and has measurable conditions for completion.
Measure Results and Reprioritize the Roadmap
An optimization initiative is not complete after deployment. The team must verify that the change addressed the original problem and did not cause a regression in reliability, security, cost, or another critical user journey.
For each initiative, compare the baseline and target with the actual result.
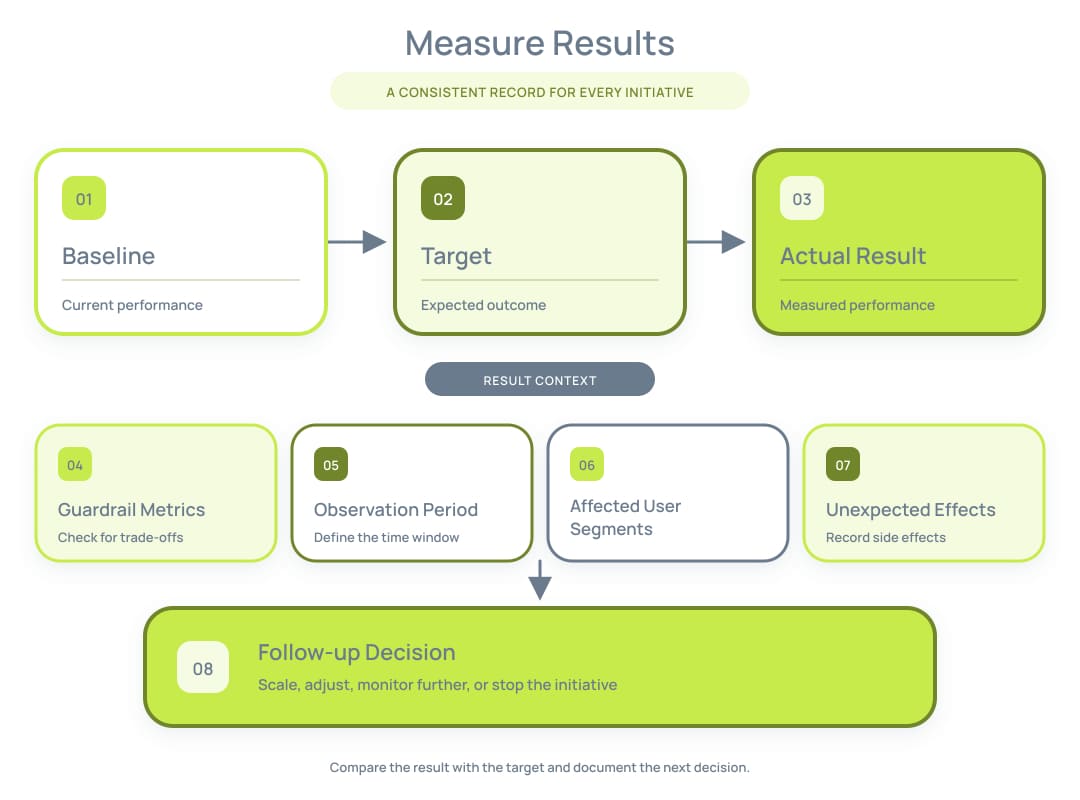
Image 3. Measuring Optimization Results
The evidence should lead to a clear decision: keep the change and continue monitoring, expand the rollout, adjust the implementation, roll it back, stop further investment, or begin the next dependent initiative. Record the decision and its supporting data so future changes to the product optimization roadmap remain traceable.
Review the roadmap after a major incident, a material change in product usage, a new compliance requirement, or a change in product strategy. User behavior, operating costs, and system constraints change over time, so an annual backlog should not remain fixed without review.
Reassessment can reveal a new constraint, change the value of dependent initiatives, or move a previously deferred problem higher in the backlog.
Section output: An optimization dashboard, a decision log, and an updated product optimization roadmap with the next ranked backlog.
Key Takeaways
A practical product optimization roadmap starts with a defined business outcome, critical user journeys, and a product health baseline. Confirmed security, reliability, and data risks require immediate attention, while the remaining backlog should be ranked by impact, risk reduction, reach, dependency value, and evidence confidence.
Deliver improvements in measurable waves, with an owner, target metric, guardrails, rollout method, and exit criteria for each initiative. Compare actual results with the baseline after release, record the decision, and update priorities as product usage, costs, risks, and technical constraints change.
Learn how Techbar supports product improvements through our Software Product Engineering services. To discuss your product constraints and engineering priorities, contact our team.

Dmytro Halkin COO
FAQs
-
What is a product optimization roadmap?
A product optimization roadmap is a prioritized plan for improving an existing product based on confirmed user, business, operational, and technical constraints. It connects each initiative to an owner, baseline, target metric, rollout method, guardrails, and validation criteria.
-
What should a product team optimize first?
Start with active security, compliance, reliability, or data-integrity risks that can cause material harm. After these risks are contained, prioritize the constraint with the strongest measurable effect on a critical user journey or business outcome.
-
How should technical debt be prioritized?
Technical debt should enter the roadmap when it contributes to incidents, delays frequent changes, creates security exposure, limits capacity, increases unit cost, or requires recurring manual work. Code quality concerns without a confirmed product or operational effect should receive lower priority.
-
How can a team measure product optimization results?
Compare the actual result with the baseline and target established before implementation. Review the primary metric together with guardrail metrics, affected user segments, observation period, operational effects, and any regressions before deciding to expand, adjust, retain, or reverse the change.
-
How often should a product optimization roadmap be updated?
Review the roadmap after each completed optimization wave and after a major incident, material usage change, new compliance requirement, or shift in product strategy. Regular reassessment keeps priorities connected to current evidence, dependencies, costs, and system constraints.